
A cargo ship departs Shanghai for Rotterdam loaded with solar modules. Whether you need silicon or solar cells, any solar panel manufactured for the European rooftop is likely to be from China. Thus, almost every stage of their production probably happened in China. China accounted for over 80% of global capacity at each section of the photovoltaic supply chain (i.e. polysilicon and modules), by 2022 (IEA 2022). By 2024, it provided more than 95% of the value of imports of solar panels by the European Union (EU). After the war, only a few industries changed their ways as quickly as the computer chip industries. One can also say that hardly any industries made the rest of the world so dependent on one supplier.
A policy dispute is currently raging in Brussels over reliance on that. In October 2026, the European Solar Manufacturing Council (ESMC) requested that the European Commission utilize the EU’s trade defense instruments right away and to create new trade instruments capable of acting before European capacity disappears. Its argument is based on value. Chinese TOPCon modules are being sold in Europe at about 10.9 euro cents per watt-peak while the ESMC sets a sustainable price at 15.9 cents or more, a gap of 31%, which has existed since August 2024 (ESMC 2026). A tariff is the obvious response.
The EU attempted this in 2013. European solar deployment was slowed by the anti-dumping and anti-subsidy duties on Chinese panels. When they lapsed in 2018, the manufacturers they were meant to protect were still in trouble. Cheng, Tsang, and Woo (2025). According to the World Trade Organization’s guidelines, dumping and subsidies are both actionable, and it is true that Chinese prices are indeed lower than any probable production cost. China’s supremacy, however, is not mere happenstance. It is the product of more than a decade of state-directed industrial policy. On the other hand, the trade defence tools of the EU are designed to correct pricing violations in the case of individual firms. This piece maintains that the options cannot reverse a structural characteristic of another economy, and the EU ought to employ instruments which can.
The framing is geopolitical. According to Blackwill and Harris (2016, 20), geoeconomics are the tools that aim to use economic instruments to achieve and protect national interest. According to this definition, the efficacy of a European response should be judged based on whether it reduces dependence and rebuilds manufacturing capacity without taxing the energy transition on which the EU’s climate targets rely.
How China built the supply chain
A long industrial chain ends in a solar panel. Quartz undergoes refining into high-purity polysilicon and is subsequently subjected to casting into ingots, followed by slicing to produce wafers and processing is done to convert these wafers into cells which are further assembled into modules. Heavy Capital Investment:
Every stage either requires heavy capital investment or a lot of state backing and cheap electricity. Hence, most manufacturing scale and state backing a lot here.
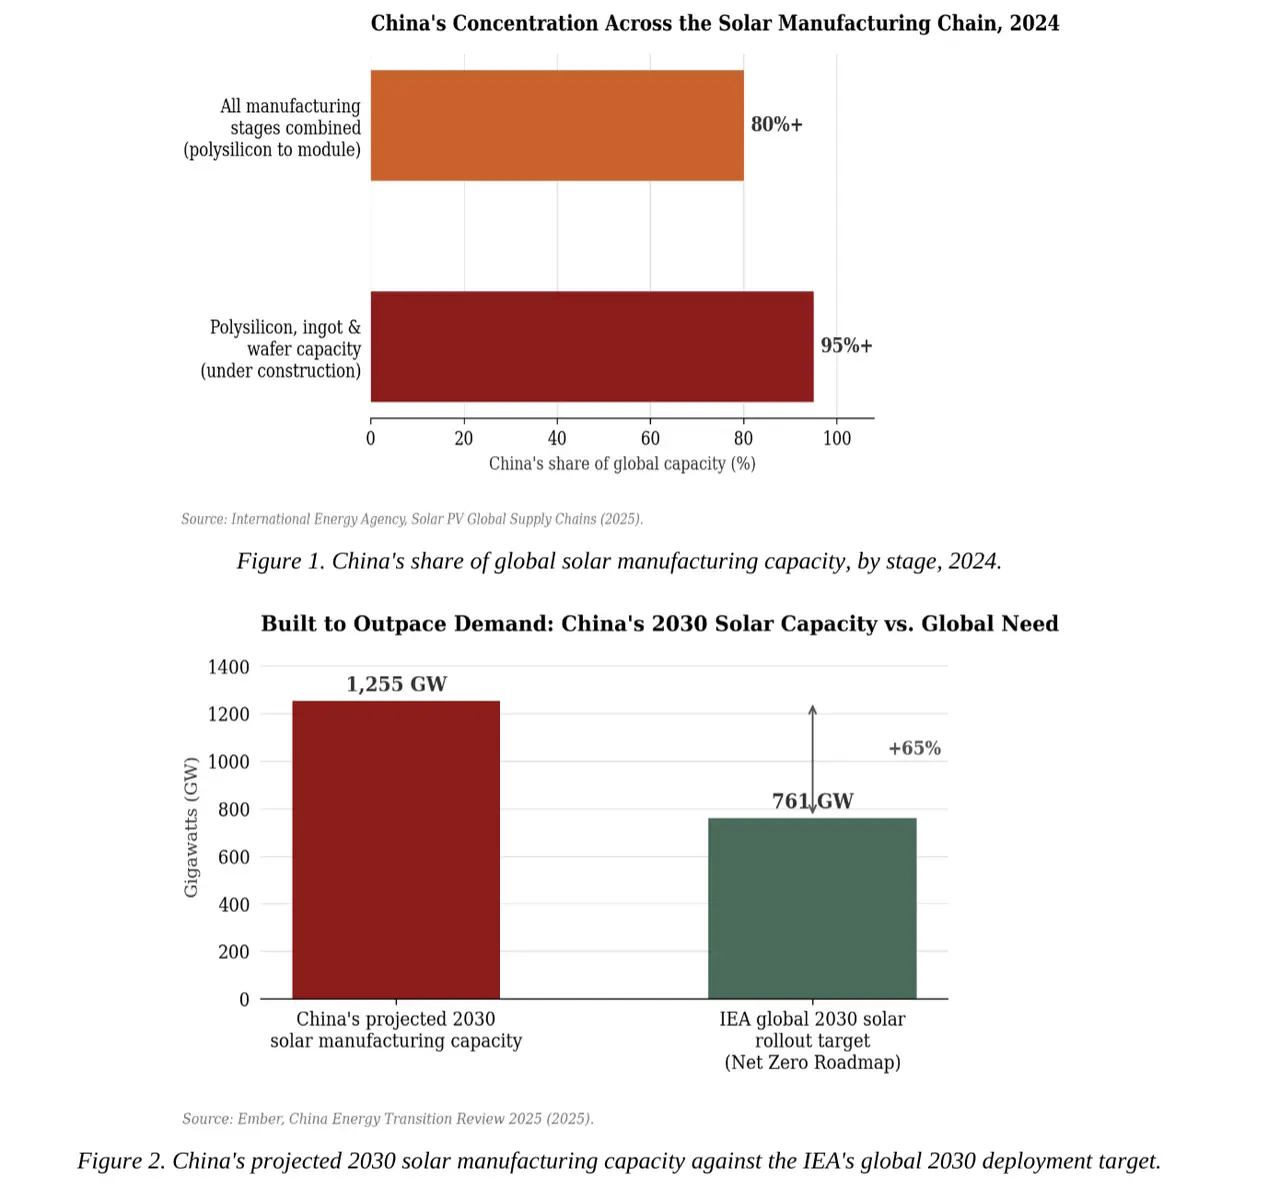
China is in the front at every stage (Figure 1) As of 2022, global capacity across the chain of the International Energy Agency (IEA) found that China already holds over 80%. In addition, IEA projects that China will see Almost 95% of polysilicon, ingot and wafer manufacturing by the year 2025. Xinjiang produced closely around 40% of the global polysilicon. According to IEA (2022), cost of Chinese manufacturing was about 35% lower than Europe’s and China had invested more than USD 50 billion in new PV supply capacity since 2011, or roughly ten times Europe’s investment.
The gap has since widened. China made 92% of the world’s solar modules in 2024 and supplied 91% of the modules installed outside its borders (García-Herrero and Mu 2025). Its four largest polysilicon producers added the equivalent of about two-thirds of existing global capacity in under four years, which left Chinese supply at roughly twice global demand (Pettis 2025).
Two points follow. The dependence runs upstream: even a module assembled in Europe usually uses Chinese wafers and cells, so a tariff on finished panels only reaches the last step. And capacity now far exceeds what any market can absorb at a profit, which follows from how the Chinese system allocates investment.
Over capacity as a system
If an industry is defined as strategic by Beijing, local governments try to land it. They provide free or subsidized land, credit and electricity, and make direct cash grants, and once public cash is on the table, local officials are unlikely to pull the plug on local champions (Pettis 2025). Local competitors rush in, sometimes dozens of state-owned and private firms at a time. Chinese observers name the effect neijuan, or involution: the endless undercutting of prices of everything from steel to manufacturing inputs, forcing prices below cost while capacity keeps expanding.
None more so than solar. In polysilicon utilisation in the solar industry, it fell below 60% in 2024 and 40% in 2025; some panels were sold below variable cost by early 2025 (Pettis 2025). Listed Chinese solar firms lost an estimated 50 billion yuan (USD 7.3 billion) in 2025, with Tongwei alone estimating losses of up to 10 billion yuan (Caixin 2026). Beijing has attempted to intervene. The Politburo made tackling disorderly price competition a priority in July 2025, and in December 2025 the sector announced a plan to buy out and shutter excess polysilicon capacity. China’s competition watchdog blocked the plan in January 2026, citing monopoly risk; and local authorities have begun recouping money from unfinished projects rather than allowing them to fail (Caixin 2026).
The contest takes place in China, but costs are exported. Where local markets cannot take the excess, firms sell it at any price to clear, and Chinese exports have dropped in price since 2023, while export volumes have risen (García-Herrero and Mu 2025). Producers in Europe see dumped Chinese solar panels, and for once they are right to do so. But no Chinese firm is trying to undercut Europe. The prices are the result of a system that, in the words of Meltzer and Pearson (2024), “tolerates low demand at home, while, even at a time of large unused capacity, spending elsewhere” on manufacturing.
The same pattern appears across steel, aluminium, lithium-ion batteries and EVs. Scott Kennedy of the Center for Strategic and International Studies (CSIS) has tracked USD 230.8bn of state support for Chinese EV production between 2009 and 2023 (US dollars, not yuan) representing 18.8 per cent of sales and a figure he calls “very conservative” as it excludes city-specific rebates and cheaper land, energy and credit (Daily Maverick 2024). Overcapacity results from the Chinese industrial policy system’s pattern of deploying capital, a policy tool that can readily pick up each individual subsidy while the source remains intact.
What trade defence can, and cannot do
There are three main trade defence instruments: anti-dumping duties (imposed when imports are sold below ‘normal value’ and cause material injury to EU producers); anti-subsidy or countervailing duties (aimed at neutralising specific subsidies from a foreign government); and safeguards (temporary measures against rapid import increase, regardless of its unfairness). Both anti-dumping and anti-subsidy rules are derived from WTO law: the Anti-Dumping Agreement and the Agreement on Subsidies and Countervailing Measures.
The European Commission issues the verdict. Typically, the Commission examines a complaint from the EU industry, then adjusts for firm-specific dumping or subsidy margins, and recommends duties to member states for approval. Because Chinese prices are also artificially high, the EU adopted what it calls a “significant distortions” approach in 2017, allowing it to construct a normal value from the prices of other reliable reference countries (Regulation (EU) 2017/2321). That simplifies dumping cases.
WTO enforcement is much weaker than it looks. The Appellate Body has been in paralysys since December 2019 over a US blockade on new appointments, and the EU, China and other WTO members are now using the Multi-Party Interim Appeal Arbitration Arrangement (MPIA), created in April 2020 as a temporary bridge (Titievskaia 2021). Rules on industrial subsidies and state-owned enterprises have not been modernised either, with members frequently failing to notify subsidy programmes so identification of Chinese support is even more difficult (Titievskaia 2021).
These tools are ill-suited for the solar problem. They take ages: a first anti-dumping filing in 2024 will take a year or two to bring duties, and they argued that the duty would arrive well after European manufacturing had closed (Science|Business 2024). They are targeted (a duty can only be applied to one product and one firm at a time) yet the contamination stretches along the entire upstream supply chain, easily spills across third nations, and the one who bears the cost for this is the installer, project developer, or householder buying a Chinese module in Europe. A tariff on Chinese modules makes each project in the EU more expensive to protect a manufacturing niche that is tiny.
The 2013 precedent
In 2013, following a complaint from an industry coalition led by the German manufacturer Solar World, the Commission slapped anti-dumping and anti-subsidy duties on Chinese panels. The case covered about EUR 11.5 billion of trade, one-and-a-half times the value of the EU’s 120 other anti-dumping measures at the time (Crowley and Song 2015). Most Chinese exporters then accepted a commitment that permitted them to sell duty-free to the EU around seven GW a year over a floor price, with a duty averaging around 47% on anything outside it (McWilliams, Tagliapietra, and Trasi 2024). The idea was to safeguard European manufacturing without hindering deployment. Neither of those happened.
They consider the duties a kind of quasi-natural experiment: a policy that applied to one group (the EU) but not another (other OECD nations), so the difference can be interpreted much as the outcome of a controlled experiment. Looking at data across 36 OECD nations from 2011 through 2018, they find the duties reduced the annual increase in solar’s share of power-sector generation in the EU from a projected 0.7% without the duties to roughly 0.2% from 2014 to 2018, statistically significant at the 5% level. Modules comprise a large portion of a project’s costs, and higher-cost modules constricted solar development. The authors estimate the slowdown increased power-sector emissions in the EU by about 0.75%.
But the 2017 Commission expiry review tells us what happened to imports. Import penetration by Chinese firms declined from 66% in 2012 to 41% in the review period; while other third countries grew from 9% to 25%, led by Taiwan, Malaysia and Singapore (European Commission 2017, recitals 117 and 125). The initial use of duties to curb circumvention, by extending duties through Malaysia and Taiwan in 2015 after discovering Chinese exports coming through these countries, helps explain much of this decline (European Commission 2017, recitals 4 and 84).
And Solar World couldn’t make it work. It entered insolvency in May 2017, withdrew from proceedings in August and entered again in March 2018, accusing the collapse of prices, the expiry of the minimum import price and a new US tariff that also stung European modules (Bernreuter Research 2018). It let the measures expire in September 2018.
Crowley and Song (2015) have one more observation. When they examined how the market responded to an entire basket of Chinese solar companies, they discovered that EU sanctions damaged private companies disproportionately, while state-owned enterprises were almost unaffected. The very policy intended to level the playing field had tilted it toward the dominant state-backed portion of the Chinese solar industry. The duties struck at the import price, and left the state-funded surpluses, with numerous channels into the EU, intact.
Why the pressure is back
While the EU has held off re-levying tariffs on Chinese modules, there is increasing clamour for them. The ESMC, which submitted its October 2026 response to the Commission’s Diversify EU proposal, called for the swift implementation of existing trade defence tools, new pre-emptive instruments, and mandatory “Made in Europe” criteria for the entire PV value chain in the Industrial Accelerator Act (ESMC 2026). It calculated the dumping margin at 46%. Legally, it may have a point: prices recovered to around 0.9 yuan per watt in early 2026 but stayed below an estimated breakeven level of 1 yuan (Caixin 2026).
A tariff might even act as a warning shot, signalling that the EU will no longer cover every excess Chinese export, and that’s important for reasons other than solar. But a tariff is a genuine expense, borne by the rest of the EU as long as no cheaper alternative exists, and it risks creating bad blood with other countries that rely on the same Chinese inputs. That became a lot harder to justify back in 2013. It’s worse. Europe remained a relatively large manufacturing bloc in 2013. Now China accounts for over 95% of EU solar panels imported by value (ESMC 2026), so a duty would immediately push up prices for virtually the entire market until EU supply scales up.
The pace is already slowing. Last year, the EU installed 65.1 GW of solar (solarPower Europe 2025a), short of 2024’s 65.6 GW and the first annual drop in 10 years. The installed fleet will hit 406 GW (a 20.4 GW increase), achieving 2025’s 400 GW goal. But the more likely scenario is that the fleet will reach 718 GW by 2030, 32 GW short of the 750 GW target. Rooftop subsidies have been reduced, demand from households has cooled and negative power prices are shrinking profits. Higher priced modules would only make the market fall further off the rails.
Chinese suppliers, too, are under pressure. As companies bleed billions and Chinese officials press for sales reductions, EU prices may go up even if there is no new duty and a duty will cement the high prices even as the glut begins to recede.
Instruments that fit the problem
Rodrik (2014, 469) argues that green industrial policy can be justified if it targets a real market failure and includes safeguards against capture and abuse. In solar, the failure is Europe’s concentration of a strategic supply chain in one country, combined with a carbon cost of production that is invisible at the border. Cheap Chinese panels are a symptom of both. The EU already has instruments that address these failures more precisely than a duty on modules, though none is complete.
The Net-Zero Industry Act
Since coming into force in June 2024, the Net-Zero Industry Act (NZIA) has set a ‘non-binding’ target of 40% EU manufacturing of net-zero technologies by 2030 (Regulation (EU) 2024/1735). But its demand-side regulations are arguably more relevant. As of 30 December 2025, member states have to use non-price criteria for at least 30% of the renewable capacity they auction each year, or for at least 6 GW. One is a ‘resilience criterion’ for when a non-EU country supplies at least 50% of EU demand for that technology, favouring bids that source equipment and key components elsewhere (Global Policy Watch 2025). Solar can easily meet that.
The resilience criterion addresses dependence head-on and does some of the market-shifting by shifting some public demand to a diversified supply portfolio-without raising the cost of every fitting on every rooftop. But it has a limited scope-it only applies to auctioned and publicly procured capacity, and the 40% threshold has no legal weight. It also varies across member states: those with manufacturing plants want rugged criteria, and those who are more interested in quick, cheap deployment hold back. The impact will depend on how often and how rigorously governments apply it: that’s what the ESMC hopes it will secure from the Commission (ESMC 2026).
The Foreign Subsidies Regulation
The FSR would take a case-by-case approach to subsidies. But in April 2024, the Commission opened two probes into the consortia competing for a 455 megawatt, partly EU-funded solar park in Rovinari, Romania: one was a consortium with a subsidiary of solar manufacturer LONGi, the other two were Shanghai Electric units. They both bailed out of the project, and the Commission closed both investigations (European Commission 2024). Simply opening investigations was enough to affect behaviour, and the cost was borne by state-backed bidders, not European consumers.
Extending the Carbon Border Adjustment Mechanism
The CBAM was fully launched on 1 January 2026, putting a price on the carbon in imports of steel, aluminium, cement, fertilisers, hydrogen and electricity. On 17 December 2025, the Commission tabled legislation for to apply CBAM on around 180 other ‘downstream’ products primarily made of steel and aluminium, with new rules on anti-circumvention. The Council agreed its first reading position in June 2026 and the Parliament in September, and trilogue discussions are underway to reach an agreement by the end of 2026 (Mayer Brown 2026).
On solar, ESMC highlights a “building block” disadvantage. A European maker importing aluminium for their module frames or steel for their mounting systems has to pay a carbon price on those inputs; a completed Chinese module or tracker made with that aluminium or steel arrives without having paid a price (ESMC 2025). Coal supplies over 60% of the electricity used in global PV production (IEA 2022). A carbon price has the same climate justification that the EU currently uses with its own makers that the WTO would be more inclined to accept.
The ESMC would like to see modules, mounting structures and trackers all included. Solar Power Europe, which represents the entire sector including installers, is less bullish: a finished module can be made of frames, glass, cells, junction boxes, and its embedded emissions are impossible to check using current tools (Solar Power Europe 2025b). Both arguments lead to a series. Mounting structures and trackers are most easily steel or aluminium with simple supply chains, so the ESMC suggests tracking them through a dedicated customs code, which means they should be first. Modules can follow once the verification process catches up. If the CBAM proceeds at a faster rate than the EU’s ability to verify embedded emissions, it becomes meaningless and will provide China with a strong complaint before the WTO.
Investment
Demand-side rules achieve little if Europe has nothing to sell. In 2024 the ESMC estimated that keeping European plants running at 40% capacity through 2025 and 2026 would take around EUR 880 million (Science|Business 2024). Public-private investment through EU funds, the European Investment Bank or national schemes can focus on the segments where Europe could realistically compete, such as high-efficiency cells and module assembly, instead of the whole chain at once.
Conclusion
Such over-concentration of China in solar manufacturing is a severe strategic risk, according to the European Solar Manufacturing Council (ESMC), which argues that “low prices of solar panels today cannot be justified by sustainable costs”. The fundamental question is how best to address it. A broad tariff affects import prices, but the real issue is the state-subsidised overcapacity that is flooding into Europe in every possible way.
A shortage in Chinese imports in 2013 prompted supply to move to Taiwan, Malaysia and Singapore. A switch in supply followed an easing in solar deployment, an expansion in emissions and the bankruptcy of Solar World two times. Now, Europe has become more dependent on Chinese solar inputs, the European solar market is shrinking, and Chinese manufacturing bankrupts itself in consolidating. To install new duties would require households and European installers to help pay for a manufacturing renaissance that tariffs cannot deliver.
But perhaps more effective instruments are less pursued. Net-Zero Industry Act (NZIA) resilience criteria may shift public preferences from a monolithic choice of supplier without taxing each project. The FSR can directly single out subsidized competitors. Extension of CBAM, slowly, at least to mounting systems and trackers, could tax imported products for the embedded costs of carbon that European manufacturers shoulder. Targeted investments would produce European products that can meet such regulations. Every approach has to be separately tested for its capacity to narrow the capacity gap and cut the dependence on Chinese manufacturers.
“China’s place at the top of the solar world was secured on more than a decade of continuous government support. A successful European strategy will very likely have to be equally patient and use tools that are finely tuned for the problem.